By TOA Technologies
Being forced to wait for hours at home for a service or delivery appointment is a frustrating experience for today’s busy consumer, and it is also an expensive one.
TOA Technologies, a software company uniquely focused on putting an end to waiting without knowing, conducted the second annual Cost of Waiting Survey and Report to shed new light on the economic impact of waiting for in-home appointments.
The report, published today, found 69% of American adults have waited for utilities, cable/satellite TV, Internet, retail home deliveries and other services in the past year.
Those that wait typically do so about four times per year, for an astonishing average wait of almost four and a half hours per appointment – costing consumers about $752 in lost time annually (based on respondent-reported values for their time).
 Enlarge image
–
TOA’s 2010 Cost of Waiting Survey puts a clearer consumer price tag on waiting at home for an appointment:
* Nearly 1 in 4 (23%) American respondents have lost wages waiting for an appointment in the past year.
* 35% have wasted a sick day or vacation day waiting for a service call or delivery.
* On average, companies make respondents wait 1 hour and 45 minutes longer than the customers expected for an appointment.
* 49% of respondents have cancelled personal plans to wait for an appointment.
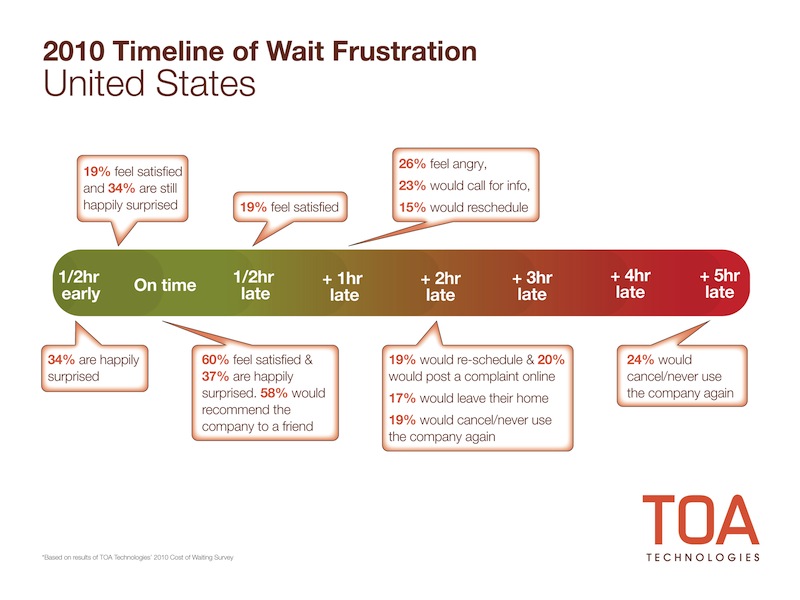
Customers aren’t the only ones who suffer from waiting at home for an appointment. Businesses are also losing money and hurting their reputations by making people wait. The margin of time companies have to satisfy their customers is slim. Customer satisfaction drops from 60% when on time to 19% when service or delivery companies are just 15 minutes late.
The Cost of Waiting Survey also found that:
* 21% of respondents switched companies as a direct result of waiting for their appointment.
* 28% of Americans waiting for an appointment or delivery gave up and left their home in frustration.
* Businesses lose $719 annually for each person who cancels or switches service providers (based on respondent estimates).
* 48% of waiting Americans contacted customer service to complain about their experience.
“The results of this year’s survey show that waiting for an in-home service or delivery is a costly proposition for everyone involved. Based on the survey’s findings, TOA calculated American adults collectively wasted about 2.75 billion hours waiting in the past year, or the equivalent of 1 million people out of work for one year. Companies that ignore the reality of consumer’s time lost and the frustration that comes with waiting do so at their own risk,” said Yuval Brisker, President and CEO of TOA Technologies.
Additional findings of interest:
* 26% of respondents said current wait times are moderately or very unreasonable; of those 62% feel the company doesn’t care about their time.
* 55% of respondents blame the company when an appointment is late.
* Almost half of waiting Americans (48%) want on-time arrivals as a customer service improvement.
* 58% of respondents said they would recommend a company for an on-time arrival.
* However, if the company is just 15 minutes late that drops to just 10%.
* 49% of people have complained to a friend about their wait experience.
* 13% of consumers have actually posted a complaint online about their waiting experience.
Demographic differences:
* 29% of respondents earning less than $25,000 annually lose wages, vs. 23% overall
* Men value their time by $6.50/hour more than women. The average perception of an hour’s value was $46.90 for American men vs. $40.40 for women.
* Waiting Northeasterners estimate their time is worth $50.40/hour, vs. Southerners’ $39.20/hour.
Methodology
On behalf of TOA Technologies, Vision Critical interviewed 1009 US adults, 1008 British adults and 1008 German adults, in detail, who had said they waited for at least one service or delivery appointment in the preceding 12 months. The interviews were conducted August 13th to August 23rd, 2010 online amongst members of the SpringboardAmerica, SpringboardUK and German partner panels, who were actively sampled to be representative of the wider adult population using a quota method. The full dataset for the US and UK (including those who did not qualify) have also been statistically weighted according to the most current Census data for gender, age and region. In the US the data has also been weighted by education, and in the UK social grade to ensure accurate representation of population in those markets. The margin of error is ±3.1%, 19 times out of 20. Discrepancies in or between totals are due to rounding. TOA conducted its first Cost of Waiting Survey in 2009.
–
1. Time to kill.
–
2. The hardest part.
–
3. Secret on your lips.
–
Comments welcome.
Posted on October 7, 2010


